Abstract
The hierarchical model of hematopoiesis posits that hematopoietic stem cells (HSC) give rise to myeloid progenitors (CMP), that can become further restricted to bipotential granulocyte/monocyte progenitors (GMP) or megakaryocyte/erythroid progenitors (MEP). We and others have shown that this model may not accurately depict hematopoiesis. Recent studies have shown that shown that populations of mouse hematopoietic stem and progenitor cells (LSK) have a strong megakaryocyte (Mk) transcriptional profile (Heuston, 2018, Epig. & Chrom.), and single cell studies have identified lineage committed cells in progenitor populations thought to be multipotent. For example, we recently reported that human MEP contain 3 populations: erythroid (Ery) primed, Mk primed, and bipotential (Psaila, 2016; Gen. Bio.).
To determine when Mk and Ery cells emerge during mouse hematopoiesis, we performed single cell RNASeq on 10000 LSK, 12000 CMP, 6000 MEP and 8000 GMP cells. Clustering analysis (Satija, 2018, Nat. Biotech.) of all 4 populations identified 33 transcriptionally distinct clusters. In 30 of 33 clusters, 85% of cells were from a single defined population (e.g. MEP). LSK and CMP clusters grouped closely together.
We used gene set profiling (Gene Set Enrichment Analysis, GO and KEGG) to correlate transcriptional profiles of clusters with specific hematopoietic lineages and cellular activities. In LSK, the most common transcriptional profiles correlated with active cell cycling. Mk-associated genes (Meis1, Myct1, and Fli1), were co-expressed with lymphoid genes in 56% of all LSK. Consistent with previous studies, we conclude that cells with Mk transcriptional profiles are abundant in LSK. No cells with an Ery RNA signature were observed in LSK.
23% of all CMP cells expressed Mk genes (e.g., Pf4, Itga2b, and Fli1) and were enriched for processes involved in platelet biology (p < 3E-18). 12% of CMP had an Ery RNA signature (low expression of Gata1, Klf1, and Nfe2) and decreased Mk gene expression (e.g., Gata2 and Gfi1b, [p < 3E-18]) compared to other CMP clusters. The high ratio of Gata2/Gata1 expression (1.90) suggests that this cluster contained immature Ery cells.
More than 94% of all mouse MEP had Ery RNA signatures. Clusters could be distinguished by gene expression (e.g., Gata1, Klf1, Tfrc) and biological processes (ribosome synthesis and heme-biology processes [p < 4 E-10]). Based on the transcriptional profiles, we determined the most mature erythroid cells in MEP were late BFU-E.
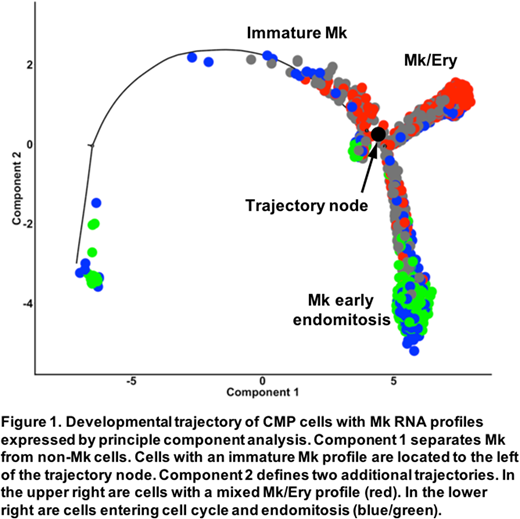
To compare the differentiation of Mk and Ery cells, we pooled our LSK, CMP, and MEP data for analysis using the Monocle software package. GMP contained only clusters expressing granulocytic or monocytic genes and were excluded from the analysis. Monocle arranges cells into trajectories based on their transcriptional profiles, with more differentiated cells positioned further from a common node (Xiaojie, 2017, bioRxiv). We found that LSK cells near the node had overlapping lymphoid and Mk transcriptional profiles. Closest to the node, we found 38% of CMP expressed a profile similar to LSK. An additional 45% of CMP formed one trajectory with lymphoid and granulocyte RNA signatures. Another 17% of CMP formed a second trajectory, with cells expressing an Mk signature closest to the node, cells with a mixed Ery/Mk signature further along the trajectory, and MEP cells with Ery-only signatures furthest from the node. To clarify the Mk/Ery divergence, we focused our analysis on the CMP populations expressing Mk RNAs (Figure1). We observed cells in G1/S phase with an immature Mk signature to the left of the node where the trajectories diverge. On the right, cells with immature Mk signatures were nearest the node and cells with a mixed Ery/Mk signature were at the end of the trajectory (upper right; Mk/Ery). Along the second trajectory, rapidly cycling G2/M Mk cells with an early endomitosis-associated RNA signature (e.g., Pf4, Gp1bb, Gp9, and Vwf) were located at the end of the trajectory (lower right; Mk early endomitosis).
Our data are consistent with a model in which two waves of Mk differentiation begin in LSK and progresses to CMP. The Mk lineage is divided in CMP, producing cells that begin endomitosis and cells that have an Mk-repressing/Ery-activating cell program that gives rise to the Ery lineage. We conclude that the erythroid lineage is derived from an Mk-like precursor and is the last lineage to be specified in mouse hematopoiesis.
No relevant conflicts of interest to declare.
Author notes
Asterisk with author names denotes non-ASH members.


This feature is available to Subscribers Only
Sign In or Create an Account Close Modal